In this hands-on tutorial you will learn:
- How to install conda
- How to create a phylogenetic tree using phylophlan
- How to visualize a phylogenetic tree using iTOL
This course is made by : Pascal Nuijten
Installation of Conda
To make downloading of packages easier we are going to use Conda. Conda has the following advantages for its users:
- Easily search and install thousands of data science, machine learning, and AI packages
- Manage packages and environments from a desktop application or work from the command line
- Deploy across hardware and software platforms
- Distribution installation on Windows, MacOS, or Linux
To install we open the Ubuntu terminal and download conda through the command line:
wget https://repo.anaconda.com/archive/Anaconda3-2024.10-1-Linux-x86_64.sh
Now we make the bash file executable and execute it:
				chmod +x Anaconda3-2024.10-1-Linux-x86_64.sh
./Anaconda3-2024.10-1-Linux-x86_64.sh
export PATH=/home/USER/anaconda3/bin:$PATH
Phylophlan
PhyloPhlAn is a powerful tool designed to analyze the evolutionary relationships between microbes by comparing their genomes. It is especially useful for studying large collections of microbial genomes and metagenomes, making it a valuable resource for researchers working with complex biological data.
With PhyloPhlAn, scientists can classify genomes and metagenome-assembled genomes (MAGs) into species-level groups, helping to organize and understand microbial diversity. It also allows researchers to build detailed phylogenetic trees that show how different microbial strains are related, using highly informative genetic markers specific to each group of organisms.
One of PhyloPhlAn’s key strengths is its ability to scale efficiently. It can handle very large datasets, including more than 17,000 microbial species, making it suitable for large-scale studies. Despite its advanced capabilities, PhyloPhlAn is designed to be fast and user-friendly, allowing researchers to perform complex analyses with minimal effort.
To install phylophlan in your conda environment you will need to run the following script in your Ubuntu terminal:
conda create -n phylophlan_env python=3.12 phylophlan -c bioconda -c conda-forge
After that you will have to activate the environment using the following script:
conda activate phylophlan_env
Now you can check if your phylophlan was installed successfully:
phylophlan --version
In this tutorial we will work with : PhyloPhlAn version 3.1.68 (6 March 2024). To run phylophlan we can do the following :
				phylophlan -i <input_folder> \

    -d <database> \
    --diversity <low-medium-high> \
    -f <configuration_file>
The settings are:
- <input_folder> is the folder containing your input genomes and/or proteomes.
- <database> is the name of the database of markers to use.
- –diversity takes value in {low, medium, high} and it’s used to automatically set the analysis to the type of phylogeny to build.
- <configuration_file> is the path to the configuration file necessary to properly run PhyloPhlAn 3.
Example
(A, B);
This means A and B are connected at the same level.
More complex example
((A, B), C);
This means A and B are more closely related to each other than to C.
Adding numbers
((A:0.2, B:0.3):0.5, C:0.7);
– The numbers after : represent branch lengths (evolutionary distance).
– A and B are grouped together first, then connected to C.
Real life example
(((Human:0.1, Chimpanzee:0.1):0.2, Gorilla:0.3):0.5, Orangutan:0.8);
This shows how different primates are related:
- Humans and chimpanzees are closely related.
- Gorillas are slightly more distant.
- Orangutans are the most distant.
Key rules
- Use parentheses
()to group related species. - Use colons
:to show branch lengths (optional). - End the tree with a semicolon
;
iTOL
- iTOL (Interactive Tree of Life) is an online tool that helps researchers visualize, edit, and annotate phylogenetic trees in an interactive way. It is useful for studying evolutionary relationships between species, strains, or genes by displaying tree diagrams that can be customized with colors, labels, and other data.
Why Use iTOL?
When scientists build phylogenetic trees using tools like PhyloPhlAn, they often generate plain-looking trees in text-based formats (e.g., Newick format). iTOL takes these trees and turns them into beautiful, interactive, and highly customizable visual representations.
Some advantages of iTOL are:
- Upload phylogenetic trees and display them interactively.
- Add colors, shapes, labels, and metadata to different branches.
- Compare evolutionary relationships by overlaying extra data like heatmaps, bar charts, or protein structures.
- Download publication-ready images in different formats.
- Simple and lightweight standalone software (Java-based).
- Allows color customization, branch labeling, and basic annotations.
- Supports Newick and Nexus formats.
- Good for quick visualization but lacks advanced interactive features.
Best for: Small-scale tree visualization without needing an online tool.
2. ETE Toolkit (Environment for Tree Exploration)
- Python-based library for advanced phylogenetic tree analysis and visualization.
- Can generate highly customized trees with scripting.
- Supports tree annotation, comparative genomics, and evolutionary models.
- Has an interactive GUI (ete-viewer) for basic tree exploration.
Best for: Bioinformaticians or researchers comfortable with Python.
3. MEGA (Molecular Evolutionary Genetics Analysis)
- Phylogenetic tree construction and visualization in one tool.
- Supports neighbor-joining, maximum likelihood, and Bayesian inference methods.
- Easy-to-use graphical interface.
Allows annotation and customization of trees.
Best for: Researchers who need both tree building and visualization in one package.
4. Phylo.io (Web-based, interactive)
- Simple web-based tool for quick tree visualization.
- Supports Newick and Nexus formats.
Interactive zooming, panning, and node manipulation. - No installation required.
Best for: Quick online visualization without needing extra software.
5. TreeViewer (NCBI)
- Built by NCBI, designed for visualizing taxonomy trees.
Integrates with NCBI’s phylogenetic databases. - Simple but useful for taxonomy-based studies.
- Built by NCBI, designed for visualizing taxonomy trees.
Best for: Viewing taxonomy trees from NCBI datasets.
For this course we will focus on iTOL using the Burkholderia tree. Go to the iTOL website : https://itol.embl.de/ and select upload a tree. You will find the following screen :
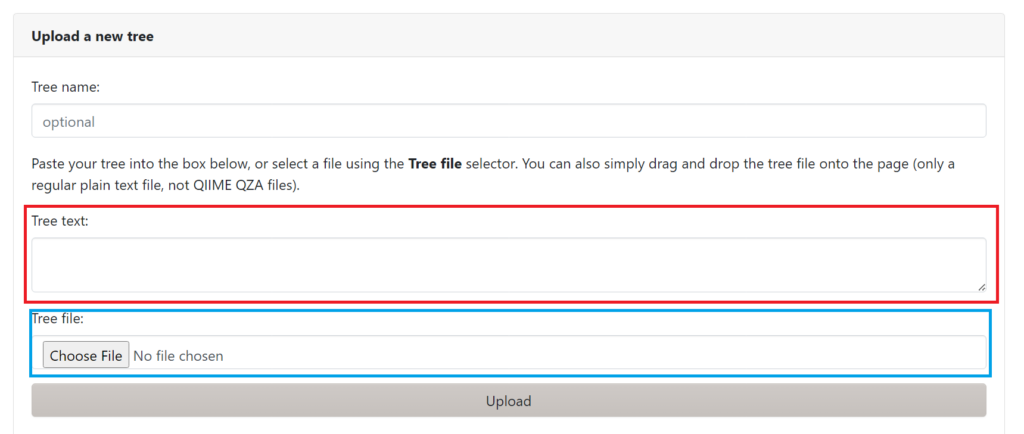
You can either directly input the tree in Newick format by copy and pasting in the red box, or choose a file in .tre format (like our burkholderia tree). After uploading the tree you will find a linear tree of our 8 Burkholderia strains. You will also see the following Control panel:
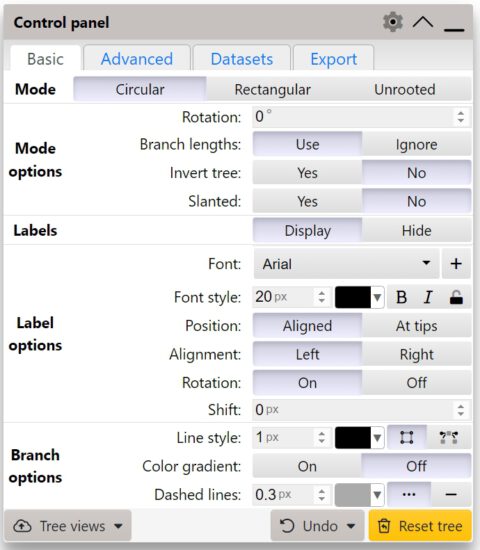
This control panel contains 4 different tabs : Basic, Advanced, Datasets and export. These contain very useful settings that you can use to optimize the visualization of your tree. Try playing around with all the settings and see what changes in your tree. iTOL also allows you to upload special files to easily annotate your tree branches/nodes. You can find more documentation about these files here. We can now annotate data for every node. We can for example add a red bubble behind the node that indicates the growth speed of these bacteria in a certain media. To do so we can download this file and drag and drop it directly in to the tree in iTOL.
Exercise :
Try to label the tree with different colored squares of the same size indicating the different species of Burkholderia in our tree. We want our final tree to look like this:
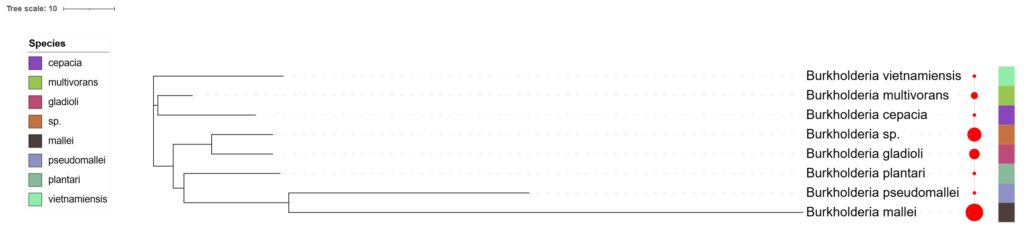
Answer: